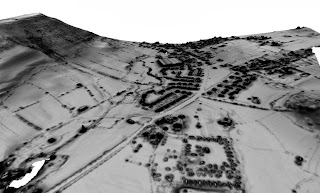
A blast from the past (but which may become more relevant again in future). Looking south(ish) towards Bradwell from the Hope Valley in Derbyshire. The dark age earthwork Grey Ditch runs across the valley from the left-hand skyline, down across the lower slopes and across the line of the Roman road towards Mich Low on the right hand edge of this view (and probably continuing to cut off the hill saddle just behind). Spent a lot of time in these fields recording the earthwork in detail with EDM (in another life). If I can find the files somewhere, I'll post a comparison (this is from Environment Agency 2m-centred lidar, so the effort with the EDM isn't wasted, yet!).
Monday 16 December 2013
Thursday 17 October 2013
Haiwarde 1595 and lidar
Above, a lidar plot from EA data of the Lincolnshire Marsh at Marshchapel showing extensive remains of medieval salt production. Below, the same plot overlain with William Haiwarde's 1595 map of the parish demonstrating the remarkable accuracy of this early mapping (although it has taken a little work in QGIS to make it fit quite this well). Almost as remarkable as his very accurate depiction of the shape of the salterns is the fact that they retain that recognisable shape to this day. At the time of his survey Haiwarde depicted small structures (salt cotes) on the most easterly of the salterns, but these were clearly the last active salterns for no more have been developed beyond these after 1595.
Wednesday 7 August 2013
Ohio Serpent Mound Lidar
Something from a little further afield. Starting with lidar survey produced by the Ohio Department of Transport. Coverting to .asc via the very useful LASTools and modelling slope severity in SAGA.
The Great Serpent Mound is thought to date to 1070 AD (CE if you like). I find myself as intrigued by the earthworks on the other side of the valley (not fully visible in this view). What looks as though it could just be a river levee turns through 90 degrees at its northern end and may be something much older. Ohio has some very interesting monuments which have benefitted from lidar research.
The Great Serpent Mound is thought to date to 1070 AD (CE if you like). I find myself as intrigued by the earthworks on the other side of the valley (not fully visible in this view). What looks as though it could just be a river levee turns through 90 degrees at its northern end and may be something much older. Ohio has some very interesting monuments which have benefitted from lidar research.
Thursday 1 August 2013
Birdoswald lidar
The Roman fort at Birdoswald on Hadrian's Wall sitting high above the steep-sided (and eroding) valley of the River Irthing. The wall itself attaches to the northern corners of the fort running eastwards to a mile-castle just before the steep descent to the river. The Vallum appears at the west of the plot with (intriguing) earthworks just to the north. Sky-view factor plot using EA 1m-centred data.
Wednesday 31 July 2013
John Pitchford's Witham
John Pitchford's 1733 map of the course of the River Witham from Lincoln to Boston, produced at a scale of 2 and a half inches to the mile (1:25,344), unfortunately does not survive. This version 'correctly reduced and drawn from the original' in 1734 is at nearer 1:80000. Nonetheless, a very accurate piece of survey for its day. It shows the route of the river prior to improvements in the 1870s. Neither of the Projected Cuts laid out here were ever undertaken, the final scheme taking a route inbetween the two. The map is overlain onto a lidar map produced from Environment Agency data showing the detailed topography of the valley and the Witham fens and the course of the prehistoric estuarine river.
Tuesday 23 July 2013
Maryport lidar
Lidar from the usual source (EA). Slope severity plot looking NE, showing the setting of the Roman fort at Maryport very well.
Here, looking in much the same direction, a sky-view-factor plot showing the impressive detail of the surviving earthworks. Excavations have been ongoing for a year or two. Plenty there to go at.
Here, looking in much the same direction, a sky-view-factor plot showing the impressive detail of the surviving earthworks. Excavations have been ongoing for a year or two. Plenty there to go at.
Thursday 4 July 2013
Caerwent
The smaller scale image doesn't really do this justice. This is extracted from Environment Agency 0.25m centred lidar survey data. Not much UK coverage at this scale, mostly very tightly focused on coastal zones and river valleys, but they do happen to have covered the site of Venta Silurum. The detail of the wall circuit and bastions, and of exposed Roman building foundations within the town, is quite amazing (for what is, essentially, an off-the-shelf product).
Here, the same expressed as a sky-view factor plot and viewed as a 3D model from the south-west.
Monday 24 June 2013
Old Sarum
Thursday 30 May 2013
Viroconium
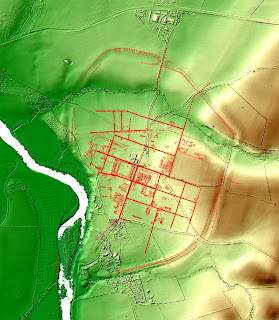
Next in our tour of Roman sites (once more courtesy of Environment Agency lidar): Wroxeter, Viroconium. The overlay of the layout of the town is from Wacher's Towns of Roman Britain, so not the most up-to-date plan by any means, but it will do to be going on with.
Wednesday 29 May 2013
Durobrivae - Credenhill - Kenchester
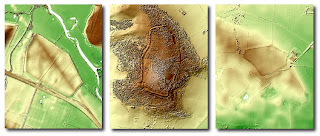
Three lidar images at the same scale: Durobrivae, Credenhill hill fort in Herfordshire and the site of the Roman town at Kenchester a few kilometres to the south. Data courtesy of the Environment Agency again.
Durobrivae lidar
Environment Agency lidar data is now freely available for non-commercial use, so I have been setting about making use of it (after jumping through a few hoops to establish my non-commercial credentials in this instance). Roman town sites are the order of the day, particularly green-field sites, as in this instance at Chesterton/Water Newton (Durobrivae). The site of the town and its defences are very evident in the survey, with the route of Ermine Street through the town to the river crossing and beyond especially clear. Dropping the cropmark plot over the top goes to show how much lidar survey can aid understanding of landscape setting (quite apart from its mapping of earthwork features). The site of the palatial complex at Castor lies towards the northern edge of the map (to be added later).
Thursday 10 January 2013
Ashby Puerorum
This rather nice cropmark plot appeared in Bewley 1998 Lincolnshire's Archaeology from the Air. Rather less helpfully, it appeared unadorned by anything as useful as NGR reference points (let alone base mapping). It is at least at a handy 1:25000 and individual cropmark complexes are provided with six-figure grid references elsewhere in the volume, so we have somewhere to start. Beyond that it's trying to spot places where the pattern is interrupted by a road line or block of woodland (the cropmarks just north of Bag Enderby do the trick) so as to position them with some confidence (even if only at this small scale). Why? Well, there may be some work on the site at Ashby Puerorum in the northwest corner. Bulldozed in the 1980s to produce embanked stock compounds the question is what, if anything, survives?
Monday 7 January 2013
ASTER + Landsat = Dacia
Up to now I have tended to work with SRTM data for small-medium scale topographic mapping (the topographic base I use for all my UK regional maps starts from there). It was always somewhat annoying that the rest-of-the-world dataset was less detailed than that available for the US... which is where ASTER comes in. Version 2 of the dataset has been out for over a year now and I must admit its taken me this long to really get round to looking at it. I like what I see. [But in some lower relief areas - and particularly the UK - it leaves a lot to be desired. Really no better than SRTM - see the useful comments here.]
The above uses ASTER elevation data for topographic mapping with a Landsat overlay to give some realistic colouration. The approach routes of the Roman armies to the Dacian fortress at Sarmizegetusa are taken from Stefan 1998. The grid squares are 5km.
Subscribe to:
Posts (Atom)


